


Introduction to Custom Field Analytics
Custom Field Analytics provides a visual overview of the data collected through your specific custom fields. Instead of exporting CSVs to calculate averages or distributions, this page generates real-time charts and metrics based on the information provided by your startups and users.
Supported Field Types:
To ensure accurate data visualization, analytics are available for the following field types:
Quantitative: Number, Currency, and Scale (e.g., "Revenue" or "Satisfaction Score").
Categorical: Single Choice and Multiple Choice (e.g., "Industry" or "Business Model").
Temporal: Date fields (e.g., "Incorporation Date").
Plan Restrictions: Custom Field Analytics functionality is available on the Program Tier 2 and Community Tier 2 plans.
Where to Find Custom Field Analytics
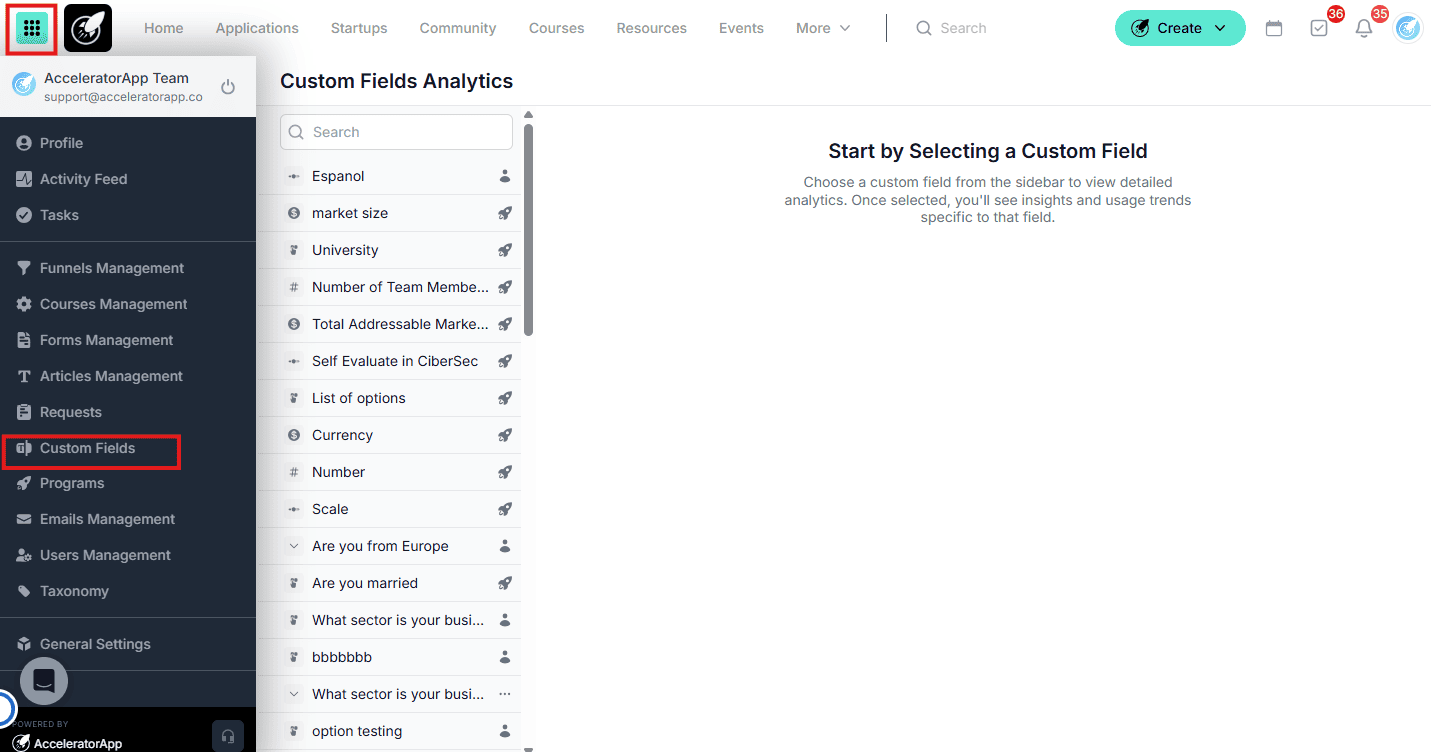
Analytics are housed directly within your Custom Fields management area. Open the sidebar menu, click on Custom Fields, and select Custom Fields Analytics tab.
Step-by-Step Actions
How to View and Filter Analytics
1. Access the Page
Navigate to Custom Fields > Analytics.
2. Select the Field
Use the search bar or list to select the specific custom field you want to analyze.
3. Apply Filters
Narrow down your data set using the sidebar filters:
- For Startup Fields: Filter by Program, Industry, or Tags.
- For User Fields: Filter by Role, Program, Tags, or Industry.
#####4. View Visualizations
The system will automatically generate a chart (e.g., a bar chart for choices or a line graph for dates/numbers).
5. Analyze Results
Hover over chart elements to see specific counts or percentages for each segment.
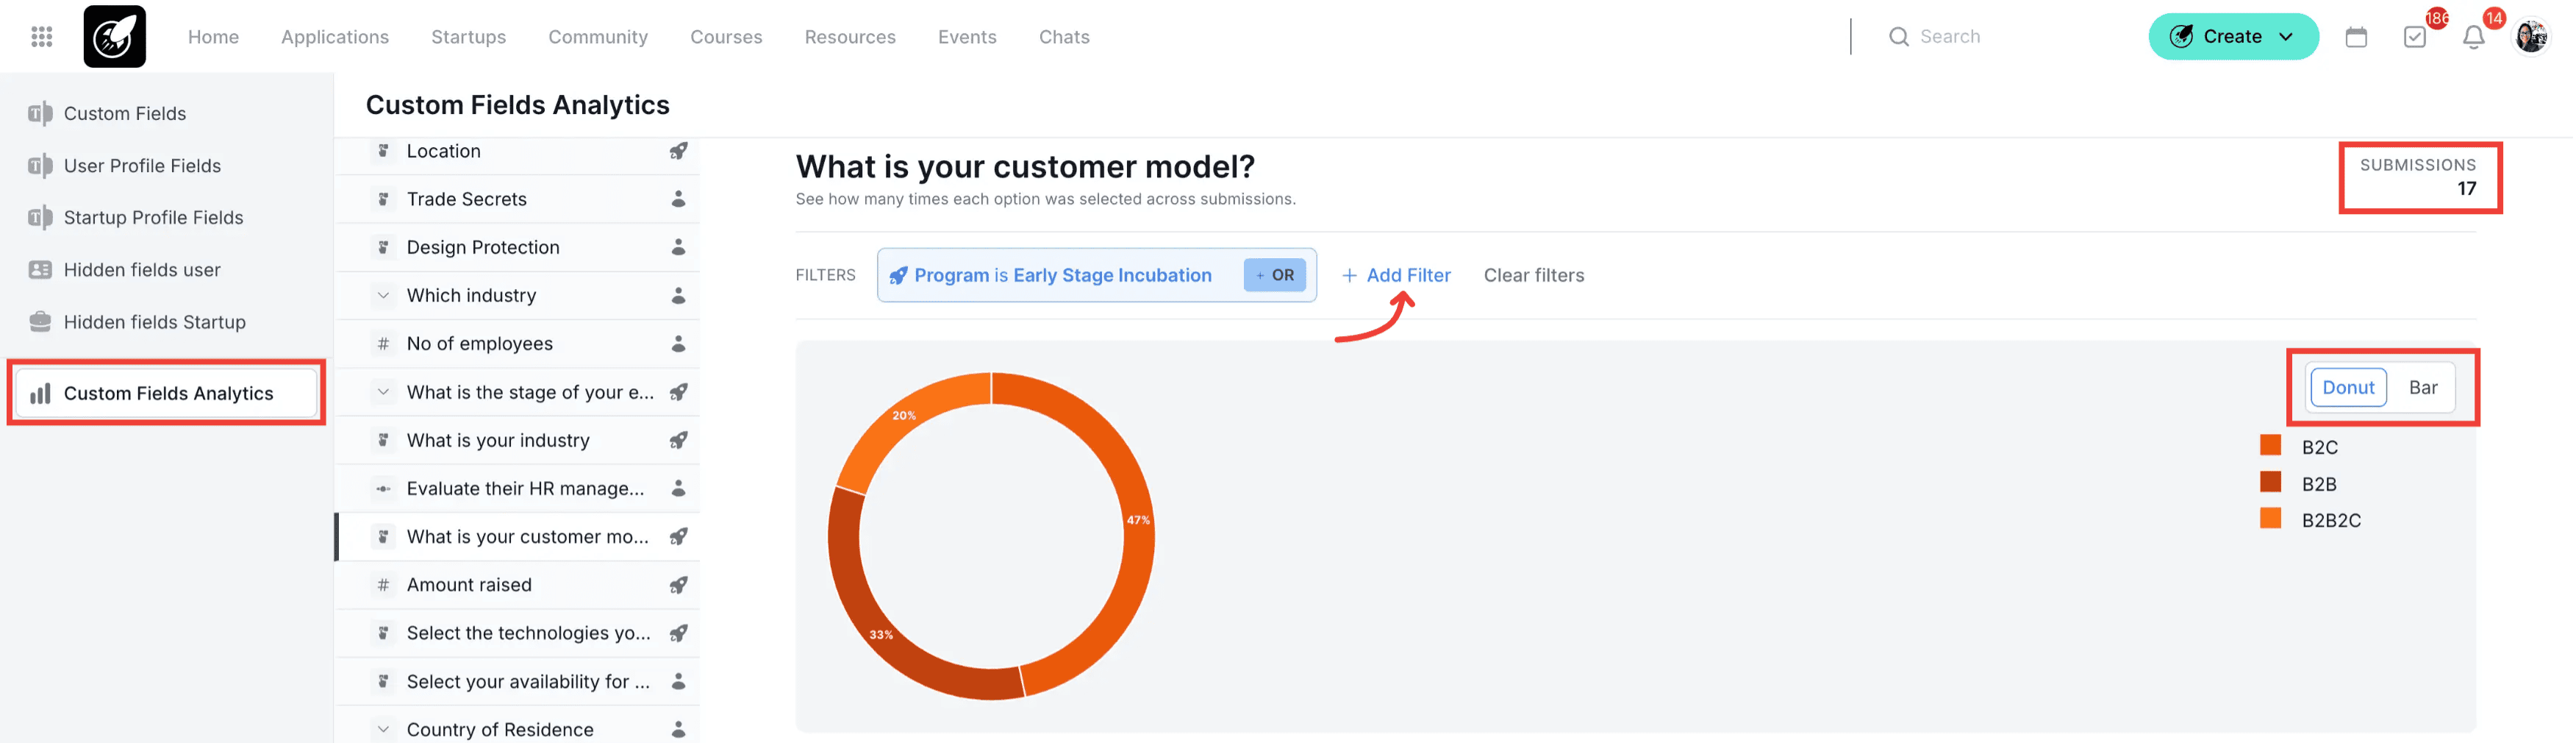
Note: When analyzing categorical fields with more than 25 choices, the platform dynamically caps the chart display at 25 columns. Any choices falling below the dataset's average threshold (typically around 3%–4%) are wrapped into a consolidated average segment so key data remains readable without horizontal clutter.
Best Practices:
It is possible to generate analytics from custom fields across multiple parts of the process. For example: Application Analytics (Applications > Analytics > Fields) or Profile Analytics (Startups > Profile Analytics > Fields).
Standardize Data: Analytics work best when data is clean. Use Single Choice fields instead of text fields where possible to ensure your charts aren't fragmented by different spellings.
Segment for Context: Always compare data across programs. For example, check if the "Average Monthly Revenue" differs significantly between your Pre-seed and Seed cohorts.